Data analysis involves mining, cleansing, modeling, and extracting data to generate useful information and insights.
In our usual organizations, we get data in a raw form which doesn’t leave enough room for immediate analysis. Still, the importance of that data cannot be denied as it provides us ample ground to conduct analysis, along with our intuition, to make the right decisions for our business.
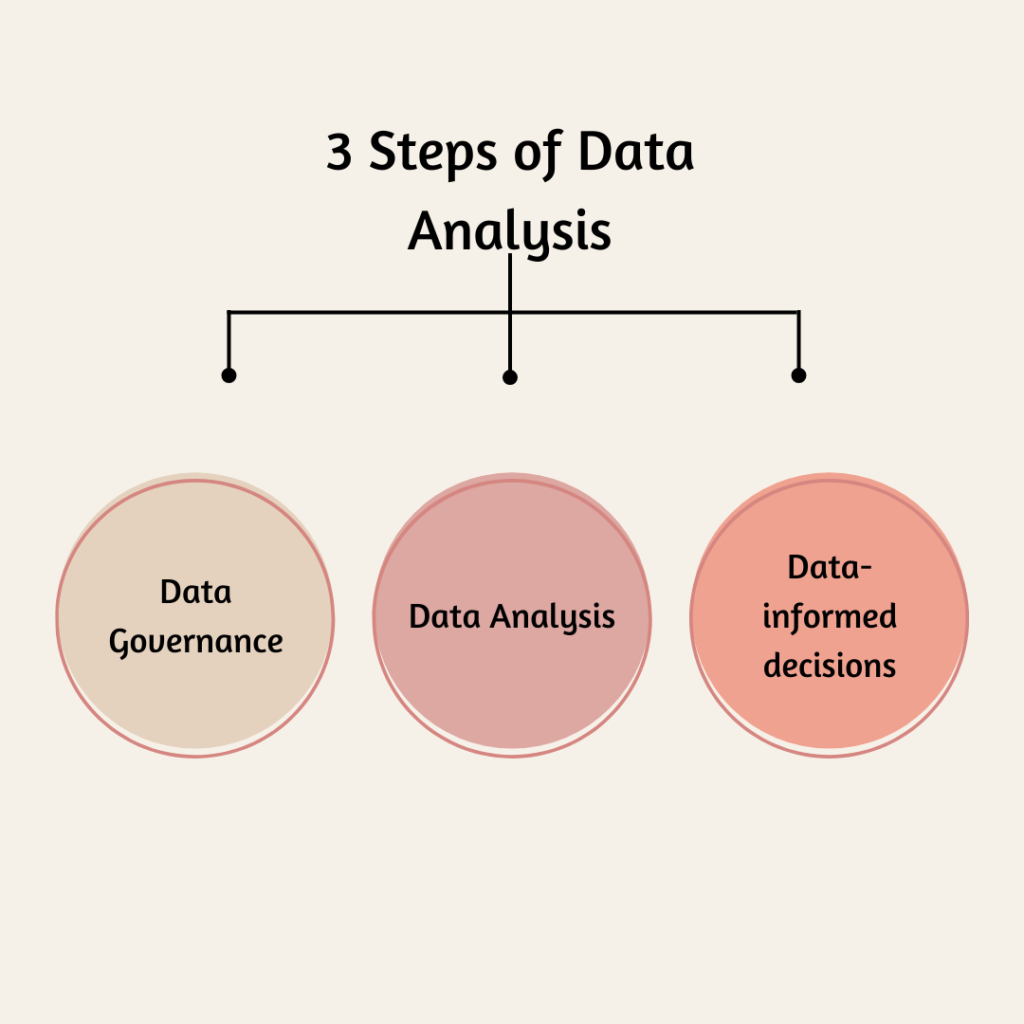
Data Analysis usually gets done in three steps.

- Data Governance
- Data Analysis
- Data-informed decisions
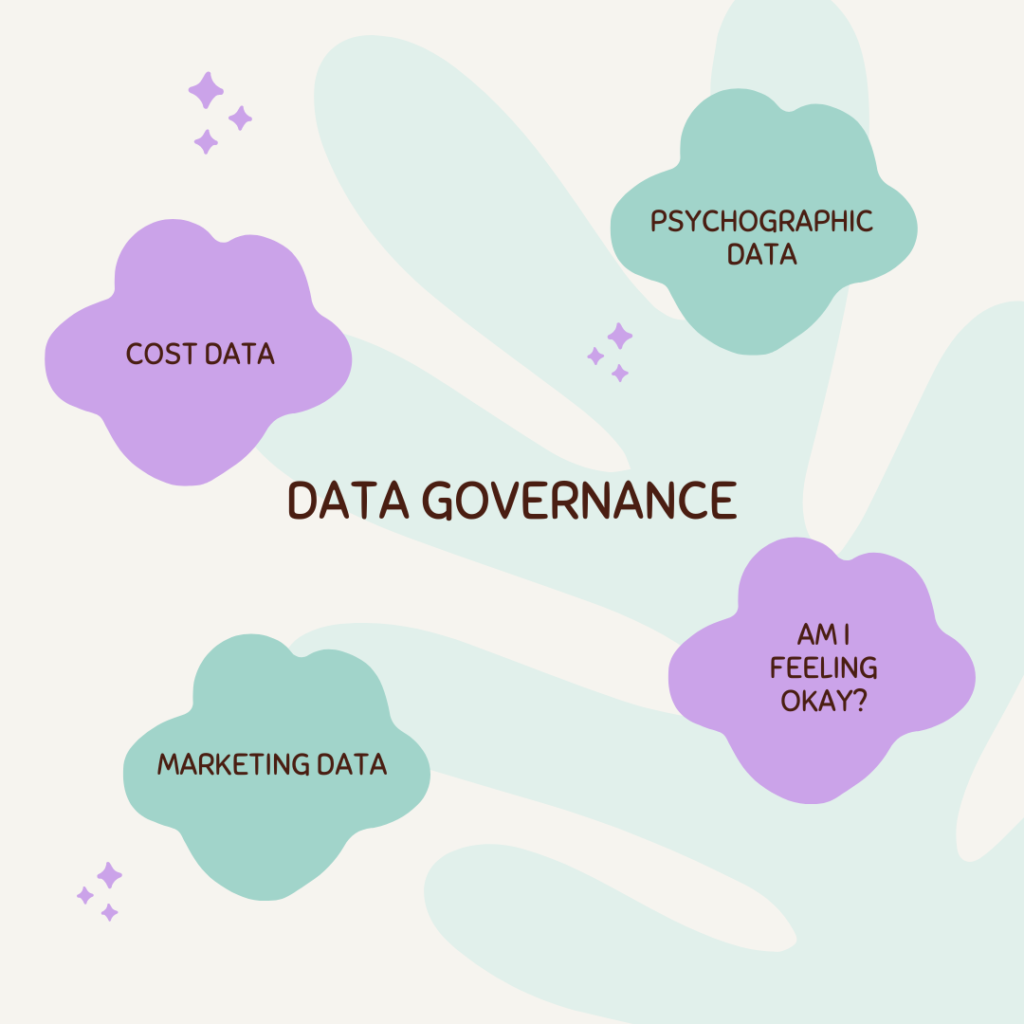
Data Governance
The first step of data analysis refers to identifying trends, raising future questions, and validating or invalidating the assumptions extracted from the given set of data.
How it gets done:
This step involves properly tracking the relevant metrics that have an impact on the business/company. This includes sales data, cost data, marketing data, and psychographic data.

Sales Data:
1. When the sales are at their max.
2. Which area of business is getting the maximum number of sales.
3. What are the points that are catering to the needs of customers
4. How the sales are coming.
Cost data:
1. Fixed costs of the organization
2. Variable costs of the organization
Marketing data:
How the potential customers are interacting with the brand.
Psychographic data:
To Gauge how people feel about the product or service.
Data Analysis
The second step of DA includes analyzing the data by identifying underlying threats and trends that may have an impact on the organization/business.
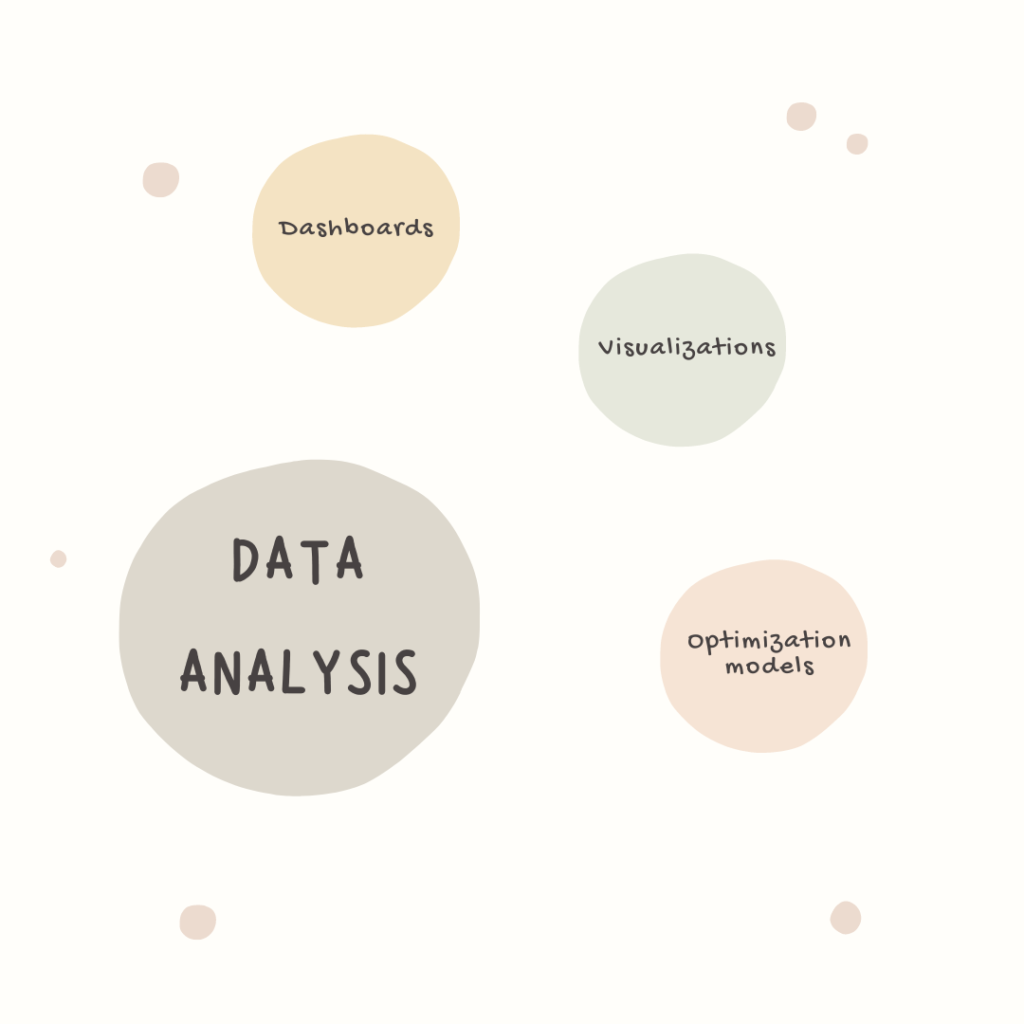
How it gets done:

- Dashboards
- Visualizations
- Optimization models.
Data-informed decisions
Data-informed decisions help organizations avoid the potential shortcomings of letting data alone guide their course of action along with leaving plenty of room for opinions and past experiences to be the guiding force.
How does data drive the decisions?
Business decisions can be derived from the extracted data by creating effective reporting and dashboards so that the data can be read dexterously. Power BI or Tableau is being used extensively for this purpose in the market. These tools give you a detailed data visualization (A visual expression of what exactly is happening with the data).
It is very rare to have a perfect set of data for the data analysis because the data is extracted from unreliable and unfiltered sources.
For example, when we conduct surveys using Microsoft Forms or any other medium online, or when we collect data in universities for research purposes, this sort of data needs plenty of filtration so that it can be used in the analysis.
With the right sources of data, the certainty can be increased by up to 80 percent, for example, Sales data of an organization or cost analysis for a business.
Once this data is sorted and filtered, it becomes the information we need to conduct our data analysis.


No responses yet